Inventory Control
Analysis Objectives and Sample Chart
ACG performance improvement work in this area is designed to help determine which products your company should stock and identify the inventory no longer needed. To make this determination, the number of times each product is ordered by customers, moved or used in build assembly over the past 12 months is measured. Frequency of order is used instead of quantity purchased because it better reflects inventory turnover, a key measure of effective inventory management and working capital utilization.
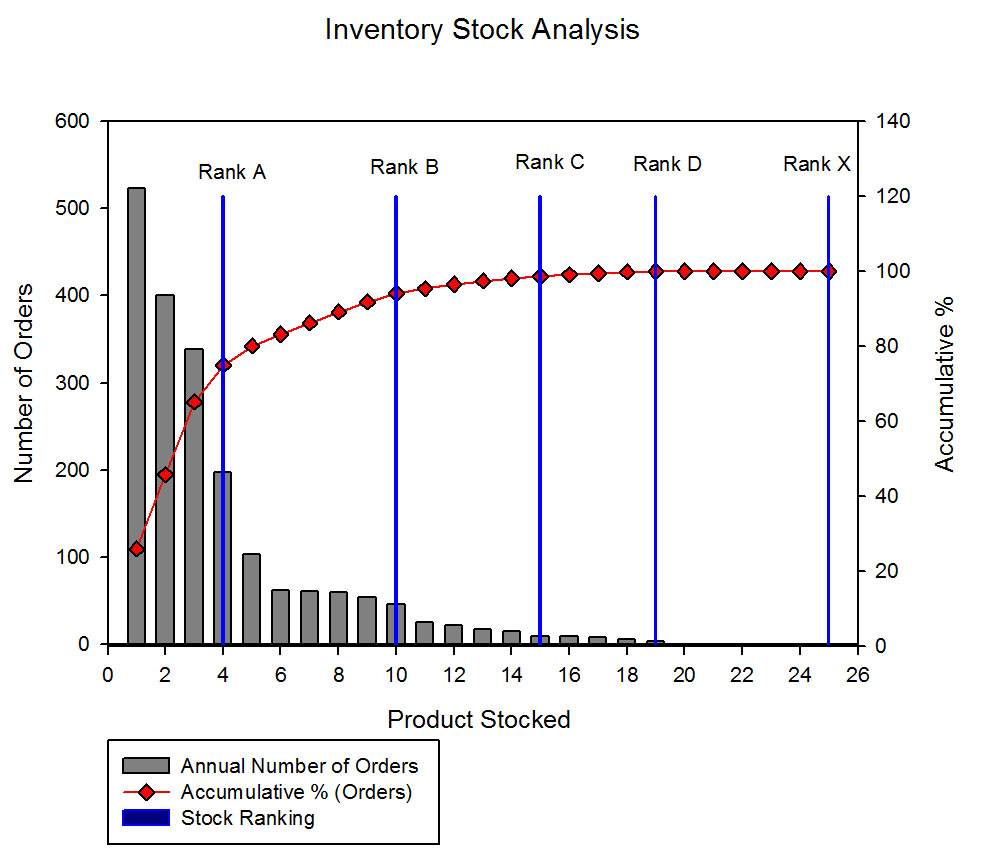
The following graph illustrates one of the reports from an inventory control project. The graph shows the sorting of all products in descending order by the number of orders and accumulative percentage of the total orders. The accumulative percentages are used to rank each product (Rank A represents the first 80% of orders while Rank D and X are the last 1% and no orders, respectively). The purpose of the analysis and resulting report is to question why the lower ranked products need to be stocked in the future and eliminating the unwanted inventory.
Data Analyzed, Models Used and End Results Achieved
The following approaches and data are used to assist in controlling and managing inventory (one example of our work in the inventory improvement area):
• To determine which products should be stocked, all items in a warehouse are sorted based on the number of times they were “ordered” (by customers, pulled or used in assembly build, etc.) in a year.
• Sorted in descending order by frequency of “ordering,” a bar chart is produced showing total orders while a line is derived based on the product’s cumulative percentages of the total orders.
• Ranks are assigned to each product based on cumulative order percentages (first 80%, next 15%, next 4%, last 1% or something similar). A separate ranking for no orders is also assigned. The increments are balanced against desired parentage of products in each of ranks (10 to 15% of products for the first rank, for example).
• Once the products with lower or no orders are determined, a decision as to whether a product should be stocked or eliminated can be made. Some of the criteria to be used for retention include:
o Product needed to support another frequently purchased item (repair part, item used in expanding capacity, etc.).
o Product desired by a valued customer just ordered infrequently.
o Premier product carried more for marketing purposes than actual sales.
Benefits Realized and Reference Case Study
• Reduction in excess inventory.
• Freeing of working capital.
• Increase in the amount of inventory space for other faster moving products.
• Lower administrative cost associated with managing the inventory.
Click on the link entitled Improving Cash Flow from Better Inventory Control found in the Resource Center for the case write-up.
