CRM Optimization
Analysis Objectives and Sample Reports
CRM systems do a good job of presenting static historical information. The views are predetermined with little interactive or exploratory capabilities available to the sales rep. However, the sales force needs more. The combination of analytical tools using CRM data provides the sales rep the in-depth support they need to maximize sales results. The analytical and visual capabilities of Tableau Software (a software package ACG uses extensively) along with CRM data from Salesforce.com enable the sales rep to harness analytics to make better sales decisions.
The following reports illustrate these analytical capabilities available to the sales force: Opportunity Pipeline report from SalesForce.com (typically used by the sales rep), Tableau visual display of Pipeline data (expands the understanding of what is contained in the SalesForce.com report), followed by Tableau’s dashboard showing many dimension of CRM data (further expands the level of information).
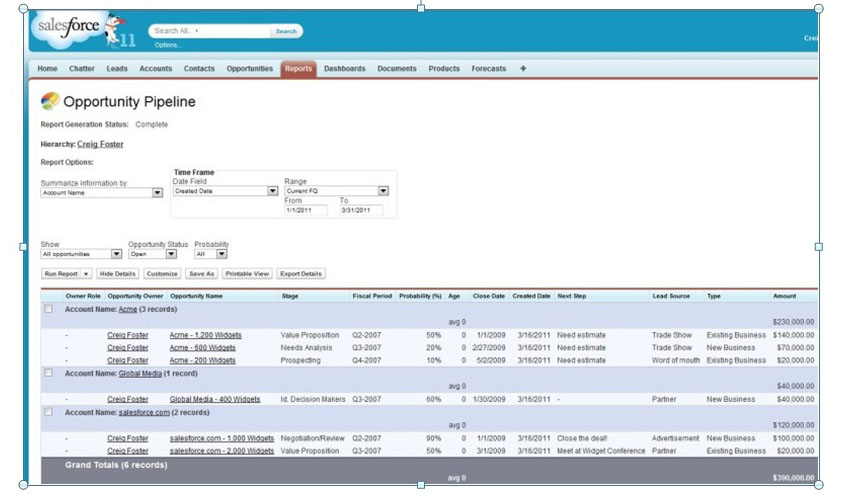
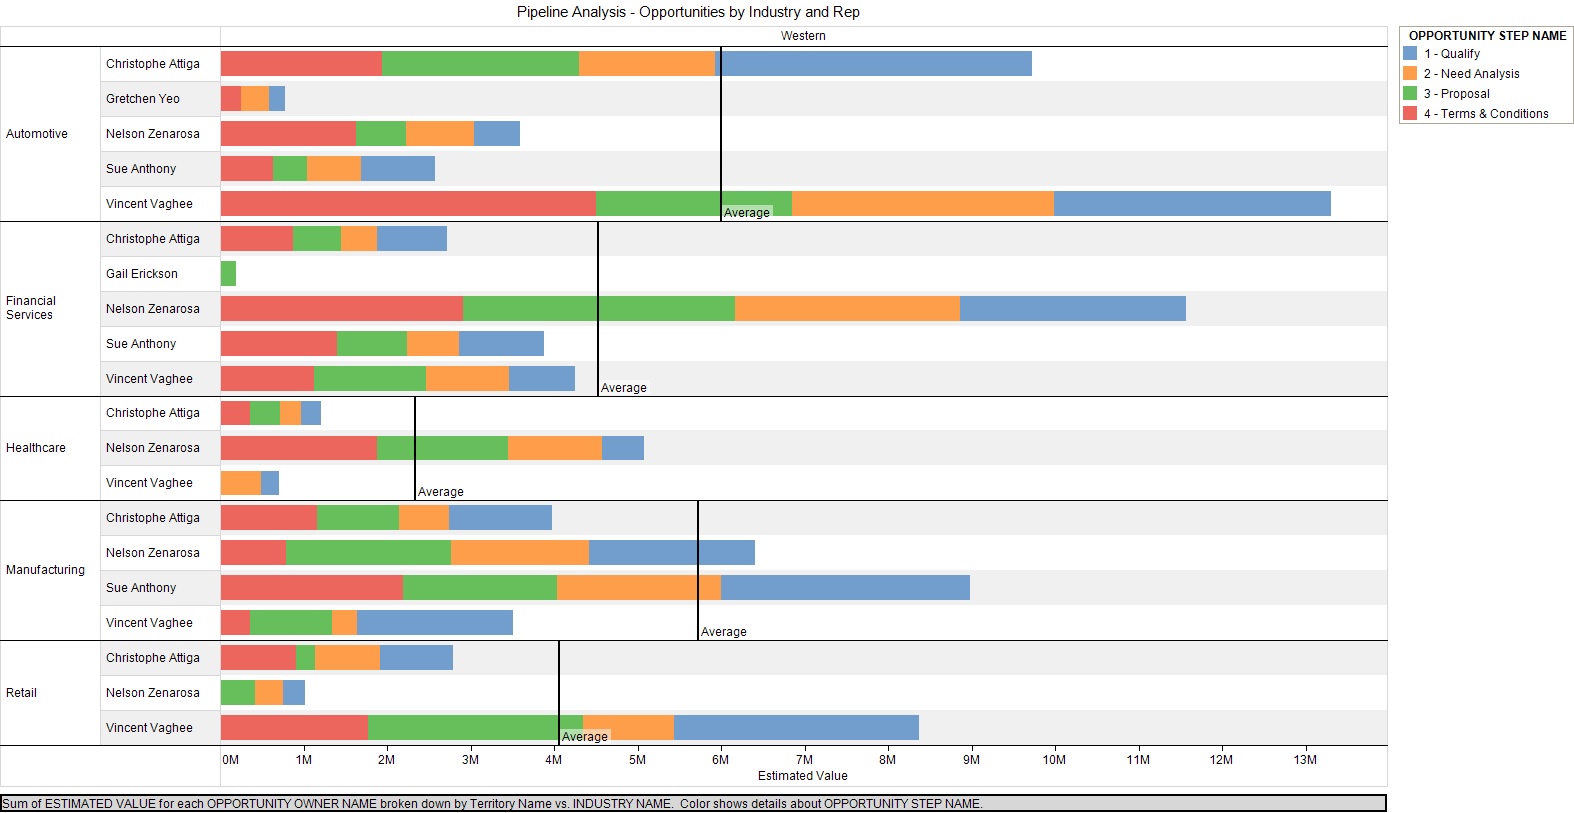
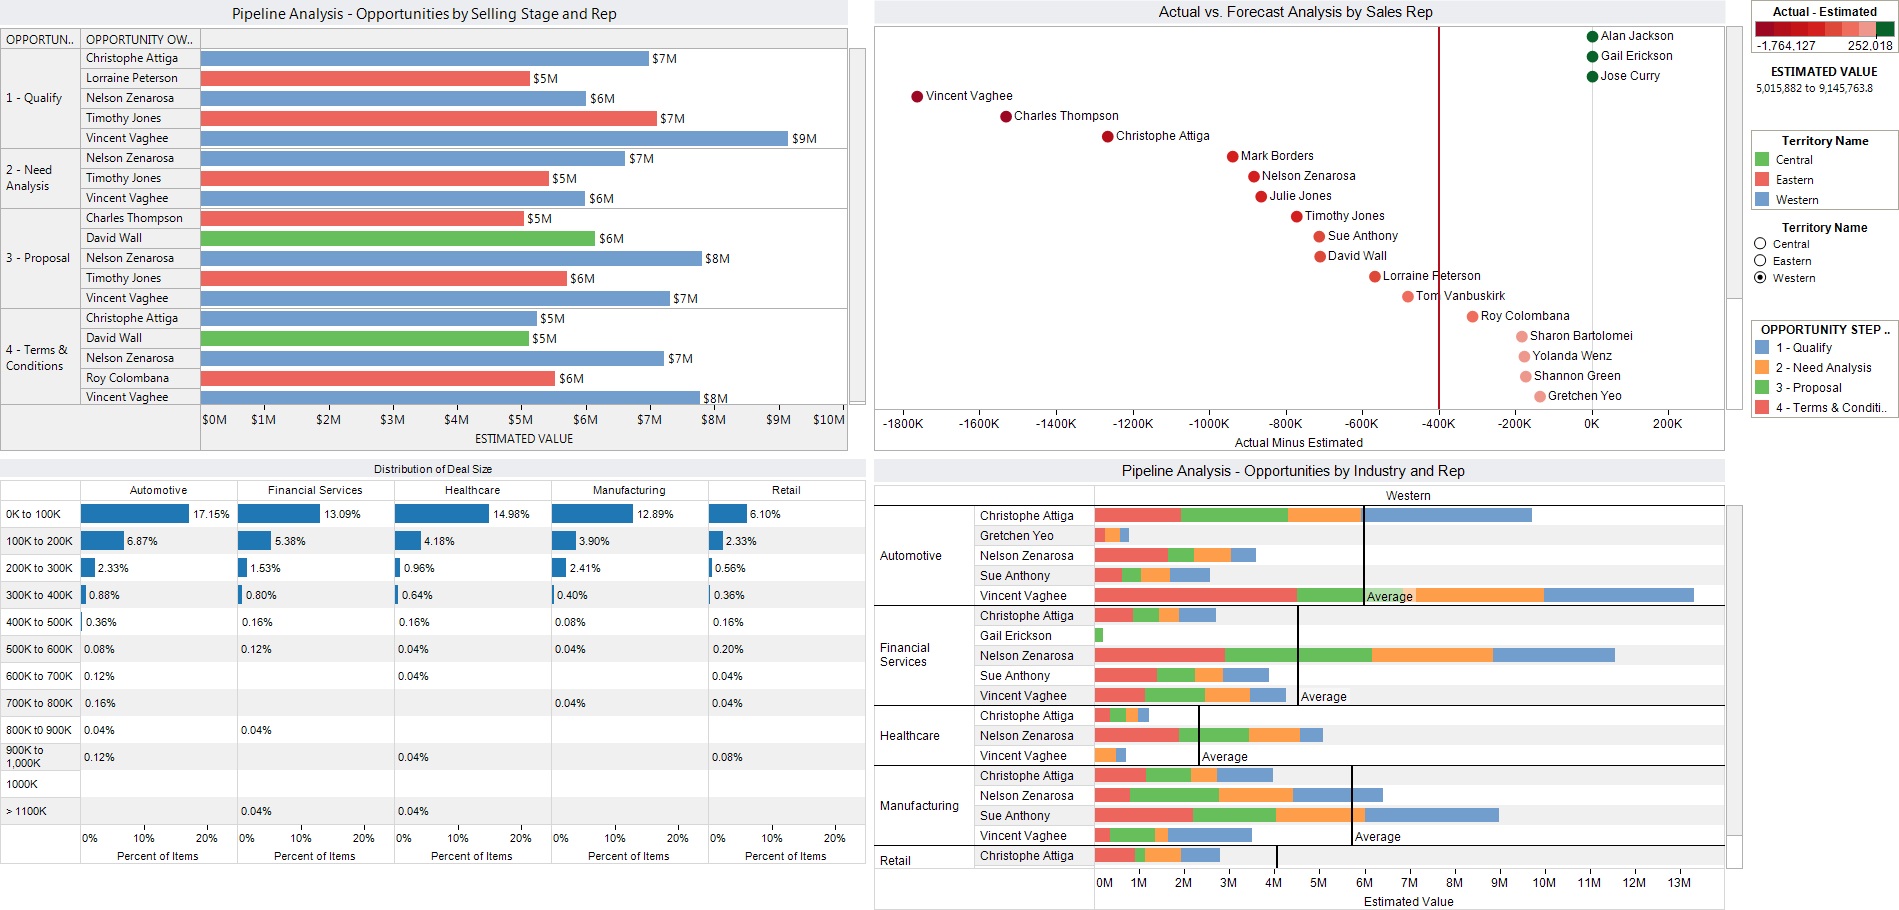
The Tableau reports shown above enable the user to better see patterns and cause/effect relationships in the data. The user is also able to visually find answers, interrogate the data further for more answers all within the same user interface.
Data Analyzed, Software Used and End Results Achieved
The following CRM data, analysis and Tableau software functionality are used to improve sales results:
• CRM data (Account, Contact, Leads, Opportunities, Contracts, Products, Reps, etc.) is captured, analyzed and displayed visually in the Tableau user interface.
• Drill down capabilities in Tableau enable the user to view the lowest level of data making up the summary figures.
• Data timeframes, relationships, sorting methods, filters and graphic displays are changed to broaden the understanding underlying the data.
• Pre-built analytical and visual displays called Tableau workbooks are used to shorten the time needed to perform the analysis (some of ACG workbooks are listed below):
o Bar chart of pipeline sales opportunities by forecasted closing quarter, dollar revenue ranges, sales rep, and product.
o Sales reps aligned by their sales performance to date (quota/forecast short fall).
o Line chart analysis showing Opportunities by rep, dollar value, product groupings, and stage in pipeline.
o Bar chart showing the distribution of opportunities by deal size and percentage of forecast.
Benefits Realized and Reference Case Study
• Increase sales by more effective utilization of information contained in a company’s CRM system.
• Merge other company and external data (support calls, marketing campaign results, industry data, etc.) for even richer insights into customers/prospects.
• Provide sales manager greater flexibility and interactivity through drill-downs, filtering, and visualizing trends, patterns and anomalies in the sales data.
• Avoid unnecessary costs associated with designing and building visual CRM data displays.
ACG pre-built Tableau workbooks are specifically designed for CRM systems giving the sales rep and manager a head start in getting to greater sales results. Insights are valuable from this type of analysis but the correct interpretation of the information and selecting the next best action to take is what really counts. ACG helps to provide an un-biased interpretation of the facts and the next best actions to take.
Click on the link for the case study entitled Turning CRM Data into a Competitive Advantage found in the Resource Center.
