Sales: CRM Optimization
Turning CRM Data into a Competitive Advantage
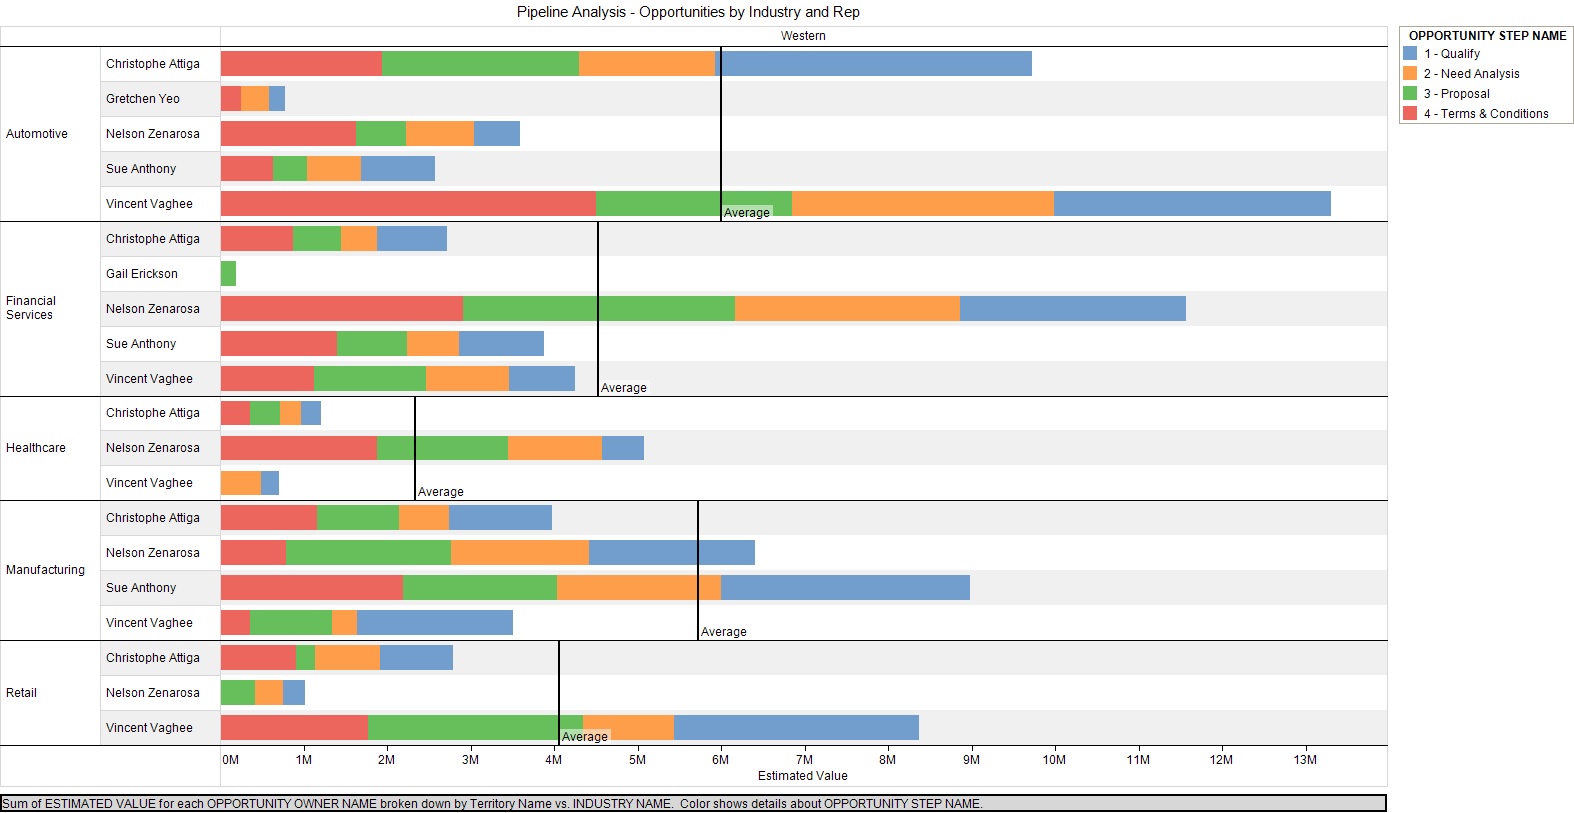 In this study, customer data used to produce the visual displays came from data (fictitious Office Supply Company) extracted from Salesforce.com. Tableau Desktop Professional Edition was used to produce these displays. The study compares and contrasts Salesforce.com screen and standard reports to the visual analytical outputs from Tableau.
The objective of this study is to show how sales can use a data visualization application to better understand the sales pipeline, adjust marketing efforts, and optimize the sales cycle to reach a competitive advantage. These capabilities for the sales force can be realized in real time to improve sales performance.
Request a Download
When you request this report, we will also update you with information on new whitepapers, research studies and more. If you no longer wish to receive our emails you can unsubscribe at any time by sending us an email message using the Contact Us page.
By submitting your email address, you acknowledge that you have read the Privacy Policy and that you consent to our processing data in accordance with the statement.
If you have any questions, please email us at creig@analyticsconsultinggroup.com
