Peer Group Comparison – Radar Map
Benchmark Peer Group and Radar Map Used to Identify Performance Gaps
ACG gathered information about this company’s key drivers of financial performance. The results are compared to benchmark industry peer group figures. The difference between the company and its peers is called a gap which is visually shown on a radar map (shown below). These gaps are then expressed by a value (improvement in cash flow resulting from closing the gap, for example) and ranked in terms of importance. The ranking determines the order in which the drivers are explored as to a possible improvement in process and/or business strategies. Even though the drivers are often interrelated, we handle discussions on a gap-by-gap basis. Focusing on those gaps with the highest financial pay-off.
Radar Map Displays Performance Gaps Versus Peer Group
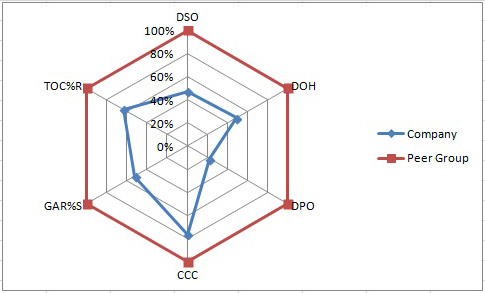
The radar map above shows the results of comparing the company discussed above to its industry peer group. Five key performance drivers displayed in the map are Days Sales Outstanding or DSO, Days Inventory on-Hand or DOH, Days Payable Outstanding or DPO, Overall Cash Conversion Cycle or CCC, Gross Accounts Receivable as a Percent of Sales or GAR%S, and Total Operating Costs as a Percent of Revenues or TOC%R.
As the map indicates the company is underperforming the peer group in all areas exception of Days Payable Outstanding (DPO). The company’s DPO figure is 190 days versus the peer group of 41 days. In this case, lengthening payables is a source of cash while DSO and DOH are uses of cash (116 for the company and 55 for peer group in the case of DSO and 262 versus 129 in the case of DOH). Any further “improvement” in cash by extending payables any further was unlikely because of hurting further vendor relationships. With the large DPO relative to the peer group explains why Cash Conversion Cycle was as close to the peer groups as it is.
For this company, the potential annual cash flow improvement by matching peer group performance in terms of Days Inventory on-Hand (DOH) would have been greater than improving Days Sales Outstanding by $15 M. As a result, focusing on improving the control and management of inventory should be the first priority.
Benefits Realized from Using this Tool
Had ACG been engaged by this company, we would have first looked at opportunities to minimize cash tied up inventory. For example, we would have looked at improving customer delivery times, reduced lead times and inventory carrying costs. We would have analyzed current methods of monitoring, managing, and maintaining inventory levels in relationship to customer demand. The analysis would have provided information needed to improve the optimization of safety stock, over-all inventory levels, inventory turns, replenishment frequency, order size, etc. while remaining responsive to customer demand.
