Peer Group Comparison – Line Chart
Line Chart Diagnostic Used to Perform Peer Group Comparisons
Continuing from the previous Diagnostic example, the company’s declining cash flow was not an industry problem at least in terms of the two measurements shown in the line chart below. The company’s Day’s Inventory on Hand (DOH) and Day’s Sales Outstanding (DSO) were compared to its industry peer group. In the chart, the company’s two measurements have had a significant increase when compared to the industry.
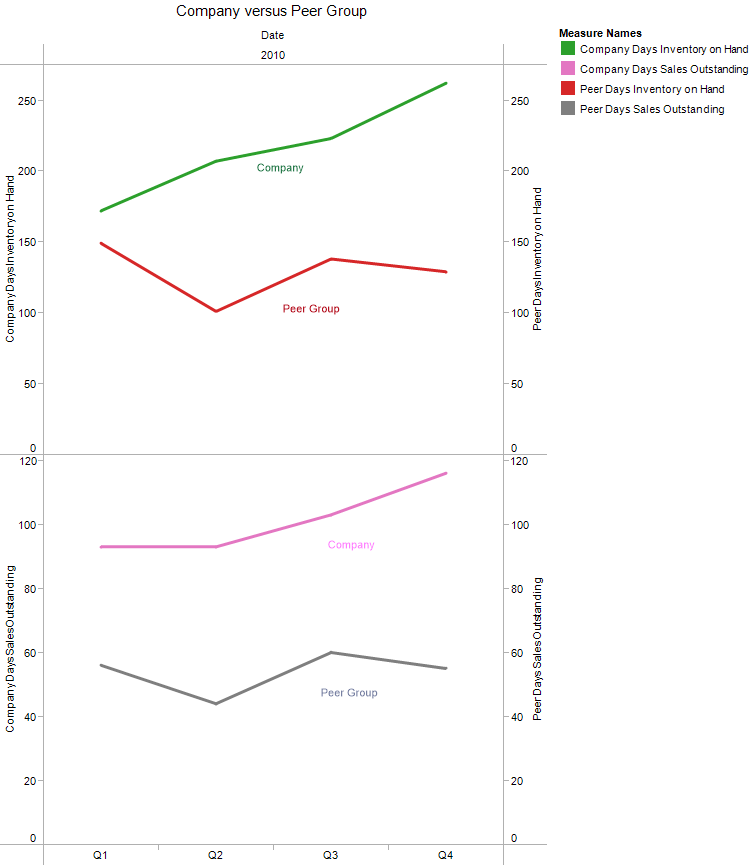
Chart of Company’s Inventory and DSO Measurements Versus Peer Group
If there were marketplace factors resulting in slower sales growth and customer’s extending payment timeframes, the Peer Group would have shown similar increases. However, the trend lines for these two measurements were essentially flat for the Peer Group during this time period. Actually, the industry was experiencing an overall sales growth during these quarters of 2010.
The company’s poor performance was explained by internal issues not industry factors. These measurements plus others are excellent diagnostic tools in determining how effective a company utilizes its liquid assets and working capital in managing its operations. For this company, a DSO approaching 120 days significantly lagged its target collection period of 30 to 90 days. On the inventory side, DHO was well above historic ranges and significantly lagged peers.
A poorly performing cash conversion cycle is a symptom of many other financial problems that can materialize at later dates. For example, the company’s allowance for doubtful accounts and product warranty accruals were historically low and well below peer group averages. The lack of provisioning in these areas actually resulted in earnings adjustments in later years because of collections and product quality issues.
Benefits Realized from Using this Tool
ACG uses Peer Group diagnostic comparisons to help spot problems brewing long before they become major issues that affect customers, earnings, and even executives’ jobs. In addition to these two measures, we also compare cash conversion cycles, balance sheet and income statement values in absolute and in comparison to each other (inventory turnover, working capital needs as a percentage of net income, etc.), non-operating sources of cash (debt), capital expenditures, gross margins, cost of sales, cost of goods sold, and a number of proprietary measures including cash-to-cash cycle – length of time from cash out to cash in, days of production in inventory, days sales in receivables, percentage of unprofitable customers, etc.
