The common practice in business is to use descriptive analysis which reviews what happened in the past. However, visual analytics and predictive analytics are much more advanced—and can be more effective.
And here’s how they work, starting with visual analytics.
Most users are accustomed to viewing tabular data or charts in spreadsheets, reports, and simple dashboards. But with visual analytics, the user can view this data and “ask a question” of it, “get the answer,” and “ask follow-up questions.” Using an interactive interface, the user can interrogate, reconfigure, and drill-down on the data.
The basic capabilities of Tableau Software (one of a number of visual analytics vendors) gathers data from a wide variety of sources (Excel, Access, relational data bases, etc.), then lets the user:
- File, group, sort, and drill down on any element in the data set
- Eliminate some data, aggregate other data, change timeframes from years to months, to days of the week all within the same visual display, without coding or writing SQL queries
- Perform instant data calculations and see the visual results.
- Drill-down to the underlying records associated with the information visually displayed
- Enable the user to “see” relationships and draw conclusions from graphics faster
- Spot trends, anomalies (outliers), and relationships easily from the visualization of the data
- Paint pictures of data using size, color, shapes, and text to aid in interpretation and understanding
- Provide geographical (US and world views) and spacial representations of the data
- Visualize multiple data dimensions on the same visual display and use different scales on the same graph
- View different dates and date-time combinations at multiple levels of detail all on the same visual display
- Provide trend analysis, showing changes over time and view the same data from different visual perspectives, providing greater understanding of the data’s meaning
- Share results and the actual interactive display with other co-workers, enabling them to add to the analysis and investigation
In addition to these capabilities, the user can build visual models, save them in workbooks, share them with others, or re-use them with other applicable data.
Here’s what visual analytics looks like (sample image comes from Freakalytics.com):
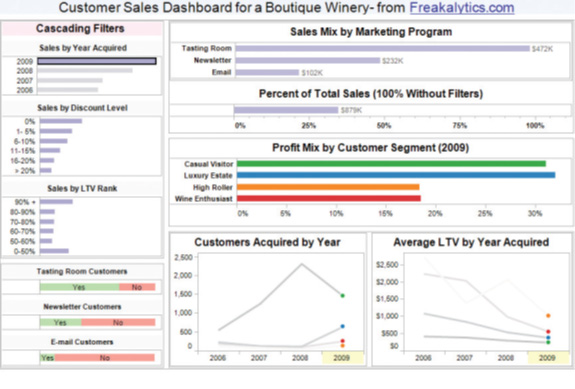
Visualizing the data as shown above improves understanding of the facts and relationships between data elements compared to viewing tabular data.
Taking analytics one step further, predictive analytics uses data mining, statistical techniques, and models to anticipate future events. The process produces scores and statistics through which the user can predict the likelihood of certain outcomes.
For example, predictive models can quantify a customer’s chances of churning (i.e., canceling their cell phone service, etc.) in time to make efforts to retain their business. Here’s an example of a predictive model built for customer churning and the model results (model illustrated using IBM SPSS Modeler software and fictitious cellphone data from University of Pittsburg):
Sample of a Predictive Model (Customer Churn Analysis)
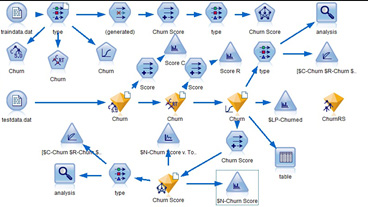
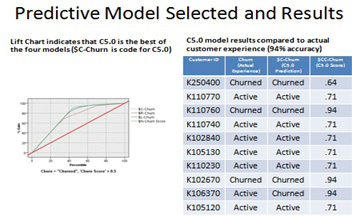
In the above example, the best predictive model (C5.0) resulted in near perfect prediction of customer outcome (churn) when compared to actual customer experience.
Predictive analytics is far more investigative and forward-looking than traditional spreadsheets, reporting, and the use of OLAP (online analytical processing). It discovers unrecognized relationships, confirms their causal effects, and uses of this understanding to make better decisions.
These models turn uncertainty about a future outcome (prospect responding favorably to a marketing offer) into a probability of the outcome happening, based on a defined action taken. For example, a marketer can determine which offer is most likely to be accepted by each individual prospect or which prospects should be grouped together (segmented), based on the likelihood they will respond identically.
Of course, even though predictive analytics adds value to a company’s decision-making capabilities, it’s the successful implementation of the decision that really counts.
Sign-off Note
I have started writing about analytics not in terms of its specific nature but how the technologies can be used in a business context. Future posts will be based on consulting projects we have completed and as a result there will be some variation in the posting of these articles. Actual client data will not be used in these posts because of the proprietary nature of the information. However, each example will be based on real world business situation. I trust, as a reader, you’ll appreciate the reality of this content and won’t mind the variability in our postings. See you soon with the next post.
 This blog contains my personal views and experiences on the use of Analytics in
business. – Creig Foster
This blog contains my personal views and experiences on the use of Analytics in
business. – Creig Foster
