Diagnostic Tools
Use of Diagnostic Tools in Delivering Our Services
ACG uses our Diagnostic Tools in a similar manner as a physician uses a physical exam and lab tests to compile a medical history and to determine what aliments the patient has. In like fashion, we use a variety of tools to gain a thorough understanding of the company, its business objectives, and current/past performance. For example, we have built a Cash Flow model to identify a company’s capability to generate positive internal cash flow. This measurement provides a good indicator of how effectively a company manages its working capital components.
In terms of the Operational Questionnaires, the tools consist of a pre-built Excel spreadsheet which lists specific questions (best practices) related to a company’s overall performance or performance in a specific department or functional area. The tool provides for numeric scoring and a valuation based on that score (benchmark scores derived from past customer assessments or industry averages).
Other tools include Peer Group Comparisons, Questionnaires, and Internal/External Opinion Surveys, among others. The following information summarizes a number of these tools. By clicking on read more, greater detail is provided as well as an illustration of the tool being discussed. Each tool description has been prepared in the context of performing a Treasury Operations Performance Assessment, one of the many services ACG provides. These same tool types are adapted for assessments performed in other functional areas such as marketing and sales.
Free Cash Throw-off Spreadsheet
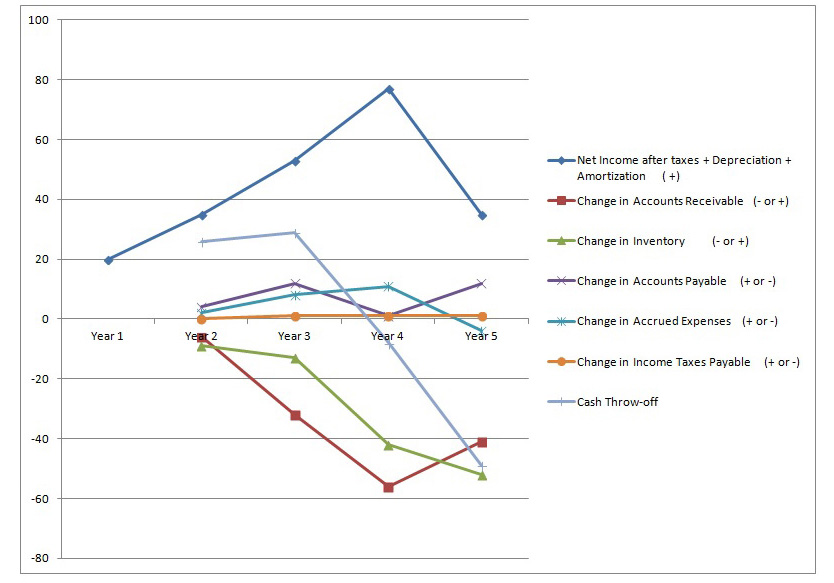 Cash Throw-off depicts, in a trend line over multiple increments of time, a company’s generation of cash from operations. In addition to net cash flow, the graph shows the sources and uses of cash from the working capital components. The tool is used to spot poorly functioning components of a company’s business operations.
Since cash flow is the life blood of any company, knowing the trend enables a company to probe deeper to determine the source of the problem (s). The graph shows the working capital components making up the cash flow figure so that investigative steps are directed to those areas with the largest negative impact. The solutions to cash short falls can be addressed by handling issues related to collection problems, need for better credit assessment procedures, duplicate invoices and quality issues, profit short falls, excess inventory, shrinking margins, inaccurate sales and cash forecasting, etc.
ACG uses this diagnostic tool in our preliminary discovery sessions to gauge the overall health of a company’s business as well as to locate areas for quick gains to fund additional improvement efforts. For projects focusing on treasury operations, this tool becomes the focal point of future efforts as well as the measurement tool to gauge cash flow improvements.
Peer Group Comparison – Line Chart
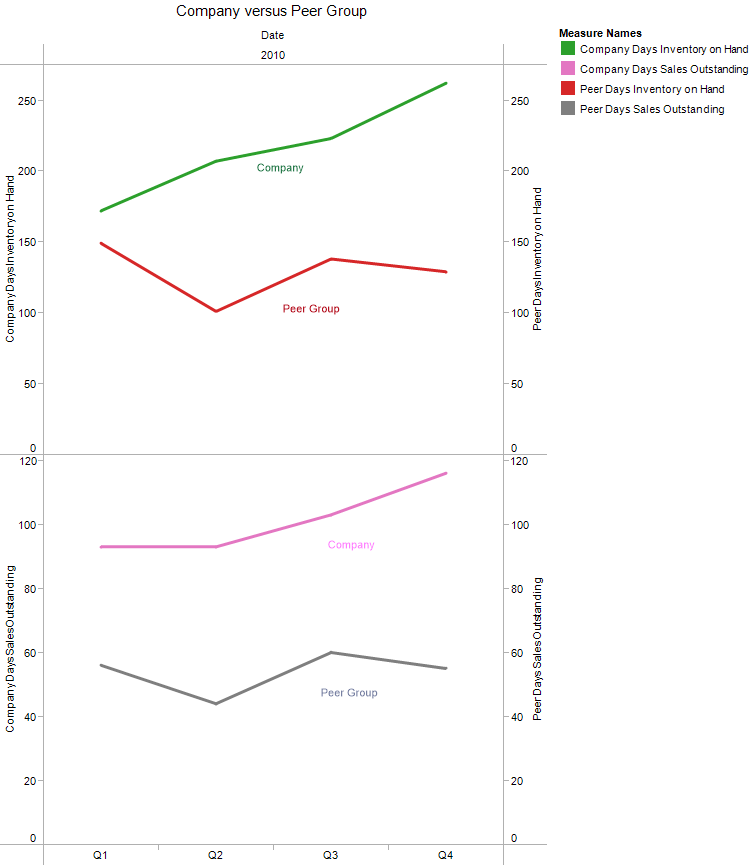 Peer group comparisons using line charts are an effective way to measure a company’s performance. Rather than looking inward to make improvements, peer group comparison is an activity that looks outward to find the best practice and highest performance and to measure how a company’s actual business operations perform against its peers.
Leading companies understand that in order to grow in an ever-changing business environment, they must have timely and accurate information for comparison purposes. Measurement is vital in helping the business leader uncover those under performing operations and those missed opportunities to ensure business processes and staff utilization are near optimal to drive business success.
Peer Group Comparison – Radar Map
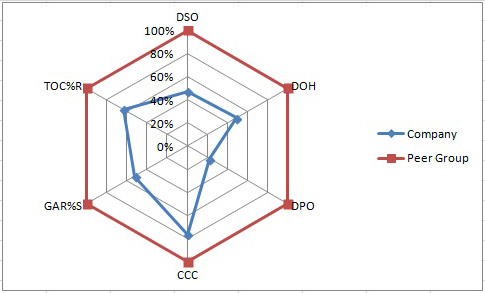 The Radar map version of peer group comparisons enables us to identify performance gaps when compared to best practices or against others. The comparison process starts with the identification of a number of business drivers that are instrumental in delivering success in the business function being studied. The drivers are not outcomes (profitability percentages, etc.) but the processes that lead to profitability. Once these drivers are established, the processes are scored in terms of level of competency – from poor practice to best-in-class.
The eight to ten drivers become the “spokes” of the radar map. The company’s scores are plotted on the map in one color while the peer group or best practice value is plotted in another color. The difference for each driver identifies the performance gap. The diagnostic tool clearly identifies the areas for improvement potential as well as what specific process or measurement needs attention.
Questionnaires
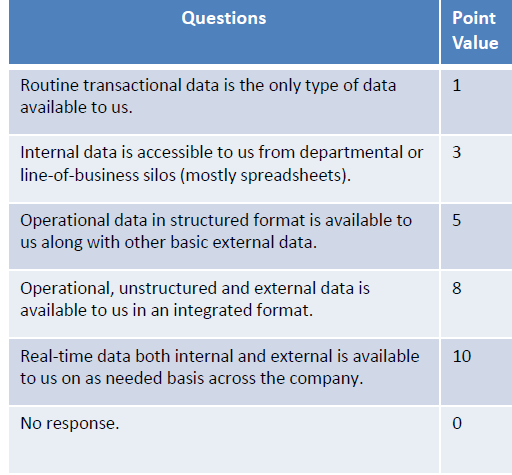
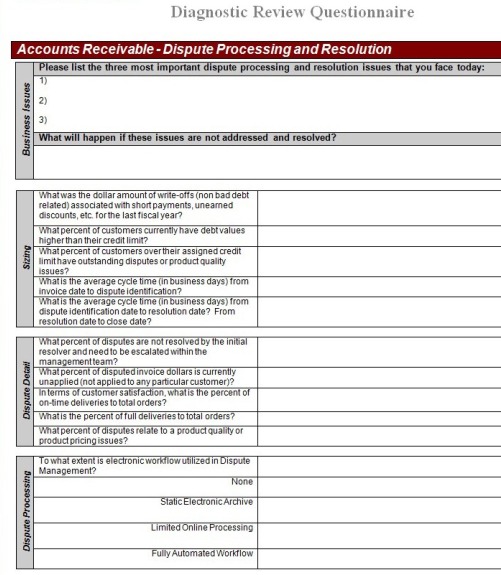 A questionnaire is often used in conjunction with direct observation or interviewing methods to gather data related to the performance of business functions or operations. Unlike the questionnaire used in producing a radar map, these questionnaires are asking for specific feedback as it relates to what is happening in the company.
Specific trouble areas are targeted for study and the questions are designed to identify the root causes of the performance issues. Again, company objectives, industry best practices or peer group information is used in developing the questionnaire and analyzing the results.
The findings are reviewed with the appropriate manager to determine intervention activities to close the gap between current actions and the desired outcomes.
Opinion Surveys
 Opinion surveys are often used to gather and compare different manager’s attitudes and opinions regarding what is important to the company. The process helps to establish a consensus on what is actually happening and what the collective organization wants to accomplish in terms of improving performance.
The results are compared to peer group responses often published by Gartner and other research organizations. In addition to internal surveys, studies of customer or supplier opinions are also helpful in identifying relationship improvement opportunities.
