Treasury Operations: Cash Flow
Maintain Financial Flexibility by Identifying and Fixing Cash Flow Shortfalls
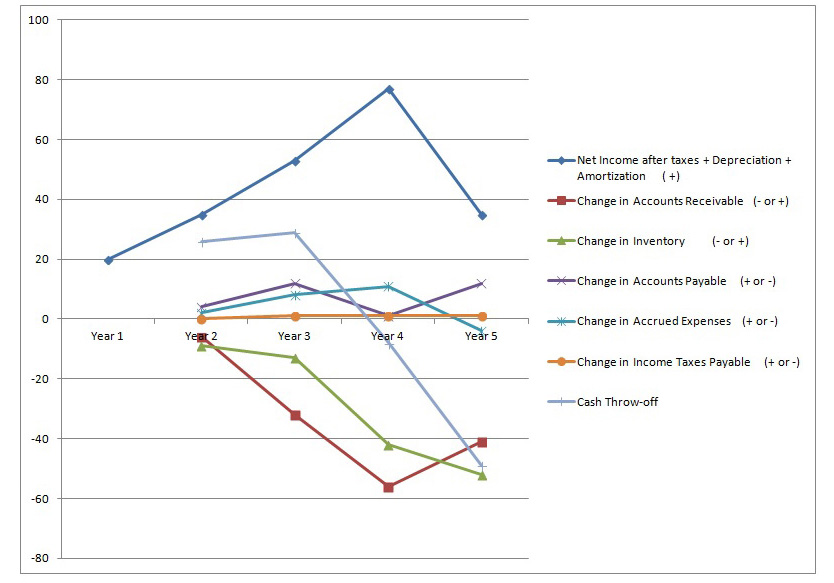 In this study, five years of balance sheet and income statement data from a fictitious company was used to construct the visual analysis to the left. The line graph shows the cash contributions and uses of the various financial components of the company. The graph clearly shows a declining cash flow trend starting at the end of year 3. Time increments can be any measurement even days if the data supports it. The Excel spreadsheet starts with inputs form the balance sheet and income statement and through a series of calculations and charts produces the final cash throw-off chart as shown to the left.
The objective of this study is to show how a visual analysis of cash throw-off can be used to spot underlying problems such as excessive inventory levels, increasing receivables, declining profit margins, etc. The early detection of the overall change can be a warning signal that problems lie ahead and that adjustments need to be made.
Request a Download
When you request this report, we will also update you with information on new whitepapers, research studies and more. If you no longer wish to receive our emails you can unsubscribe at any time by sending us an email message using the Contact Us page.
By submitting your email address, you acknowledge that you have read the Privacy Policy and that you consent to our processing data in accordance with the statement.
If you have any questions, please email us at creig@analyticsconsultinggroup.com
